Pages

Thursday, August 23, 2012

Add a marquee in WebI Report using HTML components

Task:

Add a marquee in a WebI report. There will be a scrolling message inside the report. The message can be text or image.

Procedure:

To add marquee in a WebI Report with a simple text, follow the steps mentioned below:

1. Drag a blank cell in the report.(Template--> Free Standing Cells-->Blank Cell)
2. Enter the code below in the Formula Editor for that cell. (Click on the blank cell and then click on fx then copy the code below)

="<html><marquee direction=right
onmouseover=this.stop();onmouseout=this.start();>This is a marquee</marquee></html>"

3. Select the cell and go to Properties tab.
4. In Display section, select HTML in Read cell content as field.
5. Adjust the cell height and width to define the scroll area.
6. Save the report.

This will show a scrolling text “This is a marquee” in the defined scroll area within the WebI report when viewed in HTML report panel.

You can also send some more parameters through the formula to get required output.

="<html><MARQUEE  DIRECTION="+[Direction]+" BEHAVIOR="+[Behavior]+"
BGCOLOR="+[BkgColor]+" SCROLLAMOUNT="+[ScrollSpeed]+" ONMOUSEOVER=this.stop();
ONMOUSEOUT=this.start();>"+[Content]+"</MARQUEE></html>"


If you want a scrolling image, define the variable Content with <IMG> tag, e.g. =”<img src=URL />”.

Wednesday, August 22, 2012

The limitations of using HTML components within WebIntelligence reports


The limitations of using HTML components within WebI reports are:

  • The HTML components are visible only in HTML report panel.
  • When saved as an Excel or PDF, the report will show the HTML code instead of the content.
  •   Use of HTML functionalities depends on the browser support.

Wednesday, August 15, 2012

Wrap Text problem in WebI XI 3.1

Issue: 

Wrap Text option not working on the column.

Solution: 

Make sure the "Read cell content as" option value set to "Text" or "Hyperlink". If this option has the value "HTML", then the Wrap Text option wont work.

Monday, August 6, 2012

#RECURSIVE Error in WebIntelligence

#RECURSIVE occurs when Web Intelligence cannot make a calculation dueto a circular dependency.

Example:Using the NumberOfPages() function

If you place the NumberOfPages() function in a cell whose Autofit Height or  Autofit Width properties are set, Web Intelligence returns #RECURSIVE because the placing of this formula in an autofit cell creates a circular dependency. Web Intelligence must know the exact size of the report before itcan return a value from the function, but the size of the cell (which affects thesize of the report) is determined by the cell content

AutoFit retains the current cell size as the minimum size and enlarges the cell size if the cell content is larger than the minimum size specified. Some Web Intelligence functions are incompatible with AutoFit cells. If any of these functions are placed in an AutoFit cell, Web Intelligence returns the #RECURSIVE error message as the function output.
For document performance, documents with AutoFit properties applied in tables will take longer to display in the Java Report Panel or InfoView. For large documents, it is recommended that a fixed sized cell width and cell height be specified instead.

BusinessObjects Web Intelligence XI 3.0/3.1: Advanced Report Design Interview Questions and Answers

Review: Web Intelligence core report design

1. A Web Intelligence document consists of three components. What are they?
Answer:
A Web Intelligence document contains:
○ A data provider or query
○ A report
○ Blocks of data
2. A query filter contains three components. What are they?
Answer:
A query filter contains:
○ An object
○ An operator
○ An operand
3. What object type does not have a list of values?
Answer:
A measure
4. When you list values in a formula, what must you use to separate the values?
Answer:
A semi-colon
5. What are the two benefits provided when you apply a break to a table?
Answer:
You can use the break to:
○ Group data
○ Display sums
6. What are the differences among a query filter, a report filter, and a block filter?
Answer:
A query filter limits the data returned from the database.
A block filter allows selected data to display in a single block and hides the other data.
A report filter allows selected data to display in a page and hides the other data. The report
filter applies to all data blocks on the page.
7. What is the difference between a section and a break?
Answer:
A section impacts the whole report page; a break impacts the table or crosstab to which you
apply the break.
A section allows you to display multiple blocks of data on the same page. A break does not
allow you to display multiple blocks of data on the same page.
8. What is the difference between an ascending or descending sort and a custom sort?
Answer:
Ascending and descending sorts impact the column of the block to which you apply the
sort.
Custom sorts impact the data in an object. When you apply a custom sort to an object, the
custom sort impacts all the blocks that use the object.
9. Why purge the data in your document?
Answer:
You can use the purge function:
○ When you want a document to refresh when the report user opens it, but you do not
want the report user to see the existing data, for reasons of security, for example.
○ When you want to send a data-heavy document to a report user. You can make the
document lighter when you purge the data. Consequently, the document arrives more
quickly.
10.What is the difference between a dimension and a detail?
Answer:
A dimension displays values that report users want to see in their documents. You can use
a dimension for a scope of analysis. You can merge a dimension with a dimension from
another data source to synchronize two different data sources.
A detail provides additional, complementary information to the information contained in
a dimension and must be associated with a dimension. A detail cannot serve in a scope of
analysis or merge with an object from another data source to synchronize two different data
sources.
11.You have two queries on two different data sources. Query 1 returns 10 rows for Region.
Query 2 returns 12 rows for Region_Area . You synchronize the two data sources by merging
the Region and Region_Area objects.
How many rows appear after the synchronization?
Answer:
When the Region and Region_Area objects contain data in the same format and case, after
synchronization:
○ 12 rows appear when the 10 values for Region match some of the 12 values for
Region_Area .
○ 22 rows appear when 10 values for Region do not match the 12 values for Region_Area.
When the Region and Region_Area objects contain data in different format or case, after
synchronization 22 rows appear. Web Intelligence handles similar values with different
format or case as different values.
12.You have a report with the objects Region, Year, and Sales revenue in Query 1, and you
have another report on a different data source with Region, Area, and Sales total in Query
2. Which objects do you choose to merge to synchronize the information in one table?
Answer:
You choose the Region objects because they are the only common dimensions. You cannot
merge a measure so you cannot use the Sales revenue and Sales total objects.
13.When you synchronize two queries from different data sources, what rules must you respect?
Answer:
Respect the following rules:
○ Object names can differ.
○ The data type for the merged objects must be the same.
○ Data must have the same case because the data provider is case-sensitive.
○ You can only synchronize on dimensions.
○ You can only display measures with synchronized dimensions. When you use them for
another purpose, duplicate values appear.
14.Can you synchronize the data between a Web Intelligence document and an Excel
spreadsheet?
Answer:
In Web Intelligence XI 3.x, when a dimension appropriate for merging exists in the two
documents, yes, you can.

Quiz: Advanced Query Techniques


1. What are the three types of query techniques used in this lesson?
Answer: Combining, Subquery, and Duplicating a query to build another.
2. If you were to use the UNION operator to combine queries, what would be the result?
Answer: The result returns all records that satisfy one of the two conditions. This is equivalent
to using an OR between query filters.
3. If you were to use the INTERSECTION operator to combine queries, what would be the
result?
Answer: Only records that matched ALL criteria would be returned. This is the equivalent
of doing an AND between query filters.
4. If you were to use the MINUS operator to combine queries, what would be the result?
Answer: All records that match the first query condition and not the second condition.
Where you place the queries determines which is the first condition and which is the second
condition.
5. List two reasons why you might want to use combined queries.
Answer:
○ To make the construction of the query easier.
○ When it is not possible to apply the required query filters using Boolean logic.
6. Can you do a subquery and return exactly the same results as a combined query?
Answer: Depending on the query, yes.
7. Which subquery operand type means that Web Intelligence will look for only one instance
of a value from the subquery that meets the query filter?
○ a. ALL
○ b. ANY
Answer: ANY. The Any option means that Web Intelligence only looks for one instance of
a value from the subquery that meets the query filter. If it finds one, it then ceases the
comparison with the remainder of the subquery output.
8. Why would you choose to do a combined query rather than a subquery?
Answer: Combined queries tend to be faster at returning the data.
9. When you change a data source, what can you choose to do to the objects in the original
query?
Answer: You can map them to objects in the new data source or delete them from the query.

 Quiz: Calculation Contexts

 1. What is an input context?
Answer:
The input context is the list of dimensions that are included in the calculation itself.
2. What is an output context?
Answer: The output context is the dimension level in which the calculation is to be displayed
in the report. For example, the output context can be the dimension displayed at the row
level; the dimension displayed at the break level, and so on.
3. Which of the following is an extended syntax context operator?
○ NoFilter()
○ ForEach
○ Block
Answer: ForEach
NoFilter() is a function. Block is an extended syntax keyword.
4. Which of the following is an extended syntax keyword?
○ NoFilter()
○ ForEach
○ Section
Answer: Section

Quiz: Character and Date String Functions


1. Name at least three character string functions used in this lesson.
Answer: Choice of Right(), Substr(), Pos(), Replace(), Length()
2. To find the occurrence of a comma in an object’s value, which function would you use?
Answer: Pos()
3. What is the syntax for the Replace() function?
Answer: Replace([string] ; “old string” ; “new string”)
4. When would you choose to use the Length() function?
Answer: To identify the length of a field.
5. Give an example of string concatenation.
Answer: Lastname+ “, “ + Firstname
6. If you want to create a formula to return the number of years between two dates, what
would the syntax be?
Answer: =DaysBetween(first date;second date)/365.25
7. Can you do calculations on a date?
Answer: Yes
136 Web Intelligence Advanced Report Design—Learner’s Guide
Quiz: Using If Logic
Page 86
1. What is another term for the logic used by the If() function?
Answer: If...Then...Else logic
2. Which of the following are examples of why you might use the If() function to group values
in a variable:
• To display categories of values
• To show values aggregated at higher levels of detail
Answer: 1 and 3
3. True/False. You can use the If() function to define a variable so that a different calculation
is used depending on the value retrieved by the object specified in the variable’s formula.
Answer: True

Quiz: Additional Reporting Techniques

1. When you apply a standard calculation such as a Sum or an Average on a column in a table
with a break, where is the calculation inserted?
• In a data cell
• In the break footer
• In the section
• In the break header
Answer: In the break footer.
2. How do you format a break?
Answer:
Select the column with the break and go to the Breaks folder in the Properties tab.
3. Which function can you use to determine whether a character string matches a particular
pattern?
Answer: Match()
4. What is the syntax for creating a running sum on Margin with a reset on Year?
Answer: =RunningSum([Margin] ; [Year]))
5. Which function would you use if you want to show the SQL for a particular query?
Answer: Dataprovider(SQL)
6. Which function can you use to override a report filter or a ranking?
Answer: NoFilter()
7. How can you display a report filter?
Answer: With the Drill Filters cell or the DrillFilter() function.

Quiz: Creating Hyperlinks

1. How do you create a hyperlink in the Web Intelligence Interactive panel?
Answer: With the Create Hyperlink dialog box.
2. When you use the Create Hyperlink dialog box to create a hyperlink to another document,
what options can you associate with the hyperlink?
Answer:
The options include:
○ Refreshing the target document when it opens.
○ Linking to a specific document instance.
○ Linking to a specific area in the document.
○ Passing a prompt value to the document.
○ Customizing the look and behavior of the hyperlink, for example, to have the hyperlink
display the document in a new window or to display a tooltip that describes the document
when you move the mouse over the hyperlink.
3. How do you create a hyperlink in the Web Intelligence Rich Client main window or the
Java Report Panel?
Answer:
To create a hyperlink to:
• A URL or website, you use the Hyperlinks dialog box.
• Another document, you use the OpenDocument command.

Review: Dimensions and details

1. A group of reports include Store name, Product line, SKU description, Quantity sold, and
Color. The first four objects retrieve important data for the reports. The Color object appears
in only one report. What object type did the universe designer assign to the objects and
why?
Answer: The universe designer defines the Store name, Product line, SKU description and
Quantity sold as dimensions and defines the Color as a detail.
2. The Purchasing director wants to analyze the Product Line information and to drill down
to Category, SKU Description, and Promotion. He does not want to drill to SKU number or
Color.
Answer: The universe designer defines SKU number and Color as details to keep the default
hierarchy easy to read and defines the other objects as dimensions.
3. A Merchandising manager has access to more than one data source – an Excel Spreadsheet
and a number of universes. She wants to bring the information from these different sources
into one table and to merge for data synchronization on the Store name and Product line
objects.
Answer: The universe designer defines the Store name and Product line objects as dimensions
so the merchandising manager can merge them.

Using Xcelsius 2008 to communicate with Web Intelligence and Crystal Reports


Utilize the new Interportlet Communication (IPC) feature in Dashboard Builder 3.1 (and within BusinessObjects Enterprise XI 3.1) to pass data between Xcelsius 2008, Web Intelligence documents and Crystal Reports.
Through the use of “Content Linking”, this type of communication can now take place between the products listed above – all within the same Dashboard Builder portlet. The steps below will walk you through the incredibly simple process of linking an Xcelsius model (used as the source) to two Web Intelligence documents as targets.
Not only can Xcelsius be used as the source analytic but it can be the target as well. Content Linking and IPC allow for linking to take place between two or more Xcelsius models.
Linking Xcelsius and Web Intelligence
Let’s start by creating a prompted Web Intelligence report. In this example, I will be using the Islands Resort Marketing Universe (that comes packaged with BOE XI 3.1) to create the report. The screenshot below is from a simple Web Intelligence report with a filter added for the Country field and set to Prompt for input. The name of the filter (or text of the prompt) has been changed to “COUNTRY”.
Prompted Webi Report
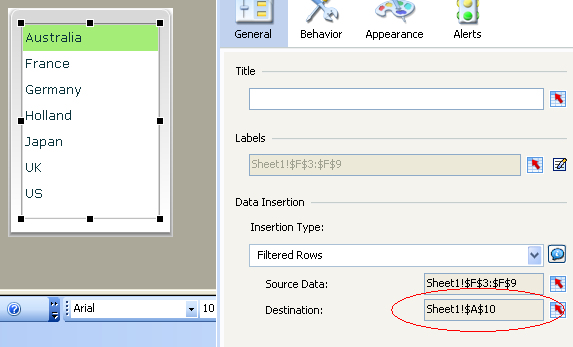
In the next step, I will create a very simple Xcelsius model that features a ListBox loaded with countries. When one of the listbox items is selected, I will pass the filtered row value to the destination cell A10.
Defining the destination location
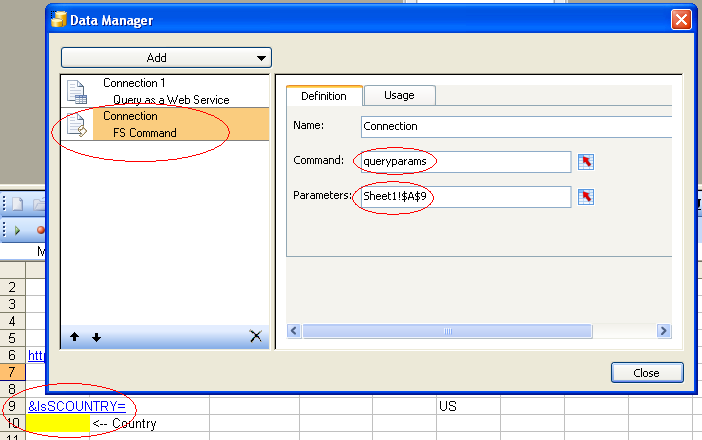
The next step is to setup the query parameters to allow Xcelsius to pass data to another reporting tool. From the main menu, click Data -> Connections. Click the Add drop-down and select the FS Command connection type.
In the Command box, enter the single word: queryparams. In the Parameters box, point to a cell that concatenates the lsS[Name] parameter with the value to be passed to it. Refer to the screenshot below.
A. In my example, the name of the prompted filter is COUNTRY. This means the parameter name that will be placed in your spreadsheet is lsSCOUNTRY.
B. Assign the destination cell to the parameter name, similar to: lsSCOUNTRY=A10.
C. Finally, to pass the parameter with the assigned value to the report, add an ampersand symbol to the beginning of the parameter name. &lsSCOUNTRY=
D. The screenshot below contains the following value in cell A9. “&lsSCOUNTRY=”&A10. This formula concatenates a literal parameter name to the dynamic value selected in the Xcelsius model. The assignment of the value is made within the Web Intelligence document.
Setting query_params
It’s now time to add both of these report objects to a dashboard – or more specifically, to a Dashboard Builder 3.1 portlet. Either select (Create Corporate Dashboard) or mouse-over Corporate Dashboards to select an existing dashboard to edit.
Create or edit the dashboard
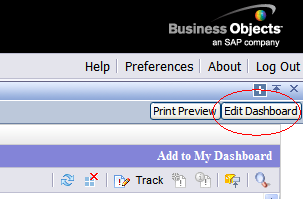
I will be editing an existing dashboard. If you have the proper permissions, you will see Edit Dashboard in the upper-right corner of the screen when a dashboard has been selected.
Edit the dashboard
Edit the dashboard
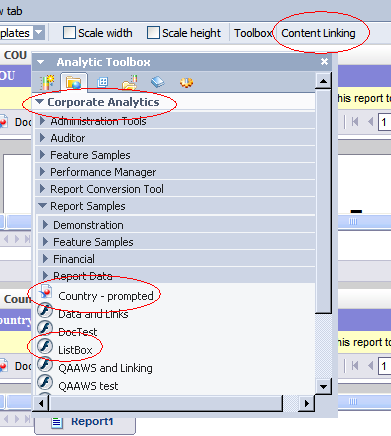
If you select Edit Dashboard, the Analytic Toolbox will open and appear on the top of your screen. The Corporate Analytics folder contains all of your published BOE XI 3.1 report objects (that you have permission to access).
You’ll see below that a Web Intelligence report called “Country – prompted” and an Xcelsius dashboard called “ListBox” have been circled. These are the two objects used in our example.
Once “ListBox” and “Country – prompted” have been placed on the dashboard, click Content Linking to enable Interportlet Communication.
Adding objects to the dashboard
Below is the screen you will see after clicking Content Linking.
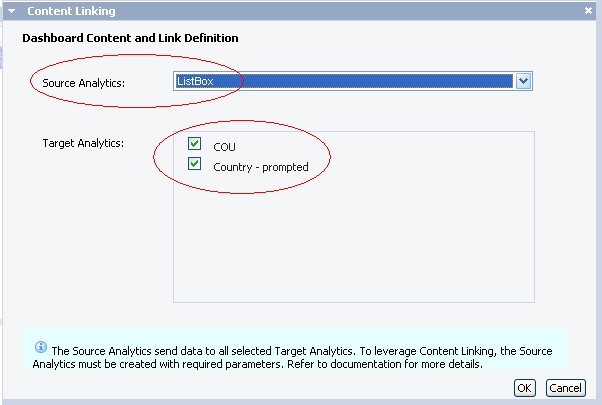
A drop-down menu is provided to allow the Source Analytic to be selected and the remaining items become available in the Target Analytics section. Two identical Web Intelligence documents were added to the dashboard, COU and Country – prompted.
Both Web Intelligence documents have been selected as the Target Analytics. By setting up Content Linking, every time an item in the Xcelsius listbox is selected, the value is passed to the prompted Web Intelligence filter as “&lsSCOUNTRY=[clicked item]”. After receiving the parameter(s), the Web Intelligence documents (or Crystal Reports) are immediately refreshed.
Content Linking definition
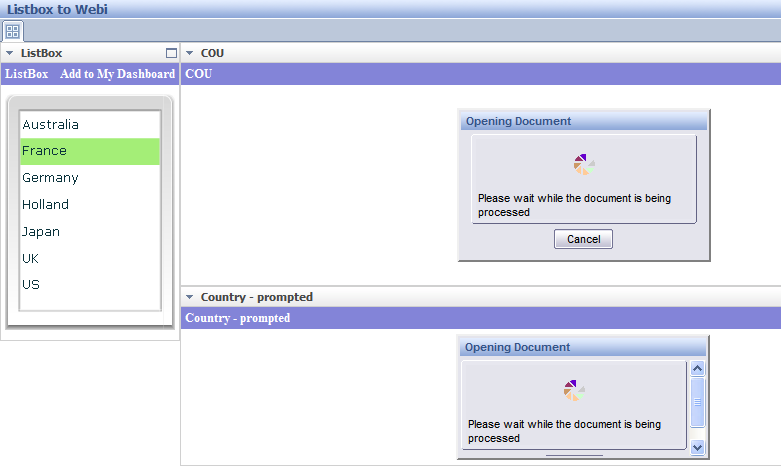
The screenshot below shows both Web Intelligence documents being refreshed at the same time. The event will take place every time a new country from the Xcelsius ListBox is clicked.
An Xcelsius selection kicks-off the Webi refreshes
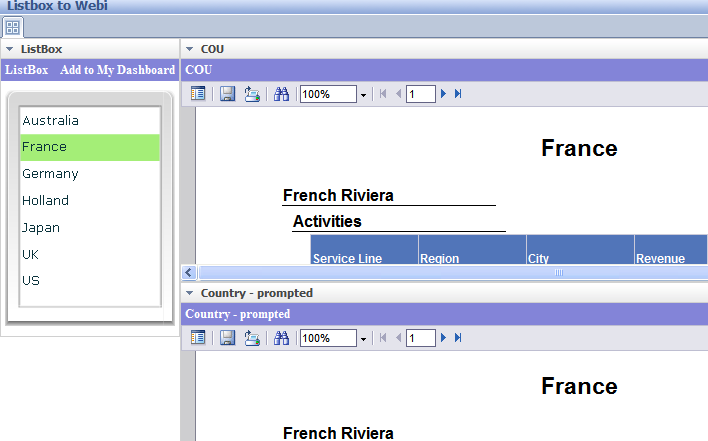
Both reports are refreshed and contain France data. If the Web Intelligence reports were created from an aggregate universe or highly optimized fact table, the reports will refresh very quickly ensuring user interest and acceptance.
Both Webi reports have been refreshed

Sunday, August 5, 2012

Increasing Interactivity In BI 4.0 WEBI Reports


Linking the Charts/Tables – simply a Dashboard feature now in BI 4.0


Raw Data Table:
P1.jpg

To illustrate this new feature I have leveraged a Tag cloud chart - a new charting sample in this blog to increase the interactivity.

1.)   1.) Select a TAG Cloud chart and set the State dimension as tags in it.

P2.jpg

2.)    2.) Now have the desired columns to be displayed in the table below and apply section on the State dimension an d insert a Pie chart into that section so that we can get the graphical view of the data as per the sections.

P3.jpg

3.)    3.) Now create a link (Report Element > Linking) between the Tad Cloud chart and the below sectioned table specifying the Dimension that will link both (mean the common dimension between both sections). Here I have linked on State Dimension.

Now experience the below interactiveness !!!
·        
  • Click on any State name label on tag cloud above, to filter data detail displayed on section below. An Element link has been defined between chart and section (Report Element > Linking).

  • Since element link target is set on whole section. Any content inserted within section will be filtered according to the state selected above.

Below is Just a Screenshot of the Final Outcome…Try this!!
P4.jpg

What is new in #BI4 Web Intelligence Feature Pack 3: an ASUG Webcast

Ref@ 
Posted by Tammy Powlas in SAP BusinessObjects Web Intelligence on Jan 15, 2012 1:04:32 PM
Gregory Botticchio, SAP Solution Management, reviewed upcoming Web Intelligence features for an ASUG webcast.

The usual legal disclaimer applies, that things are subject to change, especially regarding “planned innovations”.
Agenda:
Product description
What’s new ?
  • Quality, Usability and Stability Improvements
  • Hierarchies and BW integration
  • Charts improvements
  • Interoperability, security and integration
     

Product Description
Where does Web Intelligence fit in the product suite?
image
Figure 1: Source: SAP

Figure 1 shows that Web Intelligence is positioned as a self-service interactive reporting product.  According to Gregory, it allows end users to answer their own questions.
image
Figure 2: Source: SAP
Figure 2 provides a product description for Web Intelligence.

What is new in Feature Pack 3 (FP3) for Web Intelligence?
image
Figure 3, Source: SAP
Continuous improvement is the focus, according to Figure 3.  Before, the users were experiencing latencies when dragging and dropping inside the report.
image
Figure 4, Source: SAP
WRC = WebI Rich Client.   Figure 4 describes the quick launch and how the application will continue to run in the background.
image
Figure 5, Source: SAP

Feature Pack 3 provides the possibility of exporting CSS sheet to an XML file.  You can look at XML on desktop, change it, and share and import back into Web Intelligence report.  The style you have created in XML file will apply on Web Intelligence report.
image
Figure 6, Source: SAP

Figure 6 shows simplified sorting on a dimension or a block on a chart by simply right clicking on measure or dimension.  Complex sorting is available via Manage Sort box.
image
Figure 7, Source: SAP

Figure 7 shows improvements with BW hierarchies and integration with BI 4 FP 3.  Of key importance is the BEx scaling factor support.
image
Figure 8, Source: SAP

For hierarchy dimensions, you had to select members one by one and to do it manually. 
Figure 8 shows with FP 3 there are two new options to select all members by name or level.
image
Figure 9, Source: SAP

Figure 9 shows input control fully supporting hierarchies for any OLAP data sources such as MSAS.
You can apply a filter to make it more “agile”.
image
Figure 10, Source: SAP

Figure 10 shows member selection and your selection will show up on the corresponding block.
image
Figure 11, Source: SAP

Figure 11 shows hierarchical chart – the same experience as hierarchy on a block
You can right click on one of the dimensions in a chart, collapse, or drill down on the member.  Gregory said this was requested by many OLAP customers.
image
Figure 12, Source: SAP

Figure 12 covers BW integration BEx scaling factor and will now appear in FP3.
image
Figure 13, Source: SAP

BI 4 came with new charting library called CVOM.  In FP3 they continue to invent in this library including the color assignment of the chart.  The waterfall chart is new.
image
Figure 14, Source: SAP
For color synchronization across sections – if you have the same chart in different sections, by setting color to one chart it will synchronize.
image
Figure 15, Source: SAP

Gregory said they received many requests to get the waterfall chart, shown in Figure 15.  This is used in the financial area.
There are two types of waterfall charts – can be based on a flat dimension, and another based on a hierarchical dimension.
image
Figure 16, Source: SAP

Gregory said they tried for same look and feel as Dashboard/XCelsius components. 
image

Tuesday, July 31, 2012

SAP BusinessObjects: Web Intelligence (WebI)

Web Intelligence (WebI) is an ad-hoc query and reporting environment within the SAP BusinessObjects suite of products. Fundamentally, it is an environment that provides self-service access to data.  Web Intelligence contains reporting, querying, and information analysis in one integrated product, helping end-users turn business insights into effective decisions.  With just a few clicks of the mouse, WebI users can quickly access and format information as well as easily analyze information to understand underlying trends and root causes.
Web Intelligence contains a highly-interactive data interface that allows the report user a great deal of flexibility to view data from different perspectives.  Although many report users may only need to build their reports from scratch, it is often necessary for the users to adjust reports to answer current business questions. With Web Intelligence, users can easily edit queries and reports to reflect their latest information needs.
WebInteligence (WebI) - Sample Report

The following options can be taken advantage by user of Web Intelligence …
• View, edit, remove report, section, or block filters
• Format and re-size cells, tables, and charts
• Set breaks and sorts
• Insert calculations
• Add rows and columns to tables
• Create and duplicate tables and charts
• Turn a grid into a chart or a chart into a grid
Web Intelligence (WebI) - Query Designer
• Create formulas and variables
• Edit cell formulas in place
• Recombine report objects within tables and charts

Web Intelligence (WebI) - Query Designer

Web Intelligence empowers users with self-service information retrieval and interactivity, while providing:
• Ability to generate answers to business questions
• Thorough business and data analysis
• An environment that utilizes business terminology rather than cryptic technical jargon
• Intuitive drag & drop interface for document creation

Some WebIntelligence Tips


1) Printing a report with multiple tabs has changed. From PDF view, when you choose the Print icon on the Adobe toolbar, the Print dialog box displays. The Print range setting defaults to All, and the page # total is the total number of pages for ALL report tabs.

If you do not want to print all report tabs, you have several options:
a) In the Print dialog box, in the Print Range section, change from "All" to "Pages" and specify a particular range of pages to print (you can determine which pages to include by navigating around the report using bookmarks on the left); OR
b) While on the report tab you want to print, hold the CTRL key (to bypass any popup blocker interference), choose the Document menu, choose Save report to my computer as, and choose PDF. Keep holding the CTRL key and click "Open" in the dialog box to open the one tab of data in a new Acrobat instance and print; OR
c) From PDF view, click the View in HTML format button on the toolbar, then click the View menu on the toolbar, and then choose Draft mode. Select text on the report tab by clicking CTRL+A to Select All, then click CTRL+C to copy it. You can then open a program like Word or Excel and click CTRL+V to paste the data. This option is best for sections of report tabs that are not too long.

2) To move a single saved report to a My Favorites folder, highlight it from the document list on the right, then right-click it and choose Organize>Cut, OR click the Organize icon and choose Cut. Then, highlight a “My Favorites” folder on the left, and right-click it and choose Organize>Paste, OR click the Organize icon and choose Paste. To move multiple saved reports to a folder, press the CTRL key, highlight the reports from the document list on the right, then right-click and choose Organize>Cut, OR click the Organize icon and choose Cut. Then, highlight a “My Favorites” folder/subfolder on the left, and right-click it and choose Organize>Paste, OR click the Organize icon and choose Paste.

3) If having trouble pulling a report into Excel or PDF, the browser may try to block the download due to security settings. To get around this, hold down the CTRL key during the entire save process - from before you click "Save to my computer As" until the moment it opens in the new program.

4) In the prior version folks had Personal Categories set up for saved reports. In this version, to organize saved reports in My Favorites, you can create folders in My Favorites to organize saved documents. The easiest way is to right-click the My Favorites folder and choose New, and then choose Folder.

5) Difference between Report Copy & Report Shortcut: A Copy makes a duplicate and creates a file unlinked to the original. A Shortcut is a pointer back to the original report. So, if the original report changes, a copy of it will not reflect that change, but a shortcut will. It acts like a shortcut to a program on your desktop, or a bookmark in your browser. Each has its own purpose. If you plan to rerun a published report from My Favorites, it’s preferable to save it as a Shortcut, in case enhancements are made to the original. However, if you need to save a snapshot of data as of a point in time, you should choose Save As while in the document, which will save as a Copy to My Favorites. Also, when sending a report to another user, you must send as Copy and NOT Shortcut (Copy is default value).

6) In Preferences, it is recommended to uncheck the 4 items listed in the General section for Document List Display for best viewing of report lists so it’s less cluttered and b/c these columns do not add value. If you want to view a report's description before opening it, choose the Open menu on the top toolbar and choose Encyclopedia. The report description displays in the Encyclopedia pane on the right. To remove the Encyclopedia from view, return to the Open menu and choose Close Encyclopedia. Or, right-click the report and choose Properties.

7) To expand all bookmarks on the left in a refreshed report in PDF view without opening each individually, after refreshing a report, click the first level of bookmarks. Then, hold the Shift and * (asterisk) keys at the same time. This expands the bookmarks to open all levels.

8) On the Document List page, if you cannot see the full list of reports in a particular group, such as
"6000-Buy/Pay", you may not have realized that there can be more than 1 page of reports in a grouping. If
you look at the page numbers in the upper right corner of the screen below the blue bar, you can tell if
there are multiple pages of reports and can navigate to the next set in the list. Also, if you want to see
more reports per page, go to Preferences and in the General section, enter a higher number in the box
labeled "Set the number of objects (max.) per page:". Most users set this number at about 30.

9) In XI, users with creator rights cannot edit a report directly from the published documents list as they
could in the past. If you want to edit a published report, first save it to the My Favorites folder and open it
from there. You will now see the Edit function displayed and can edit the report in the Java Panel (if a
WebI doc) or DeskI (if a DeskI doc and you have DeskI access).

10) In the previous version of the WebI Java Panel, additional description (aka help text) was displayed
for report objects at the bottom of the Edit Query screen. In XI, if a description/help text exists for a report
object, it will display next to the object when you hover your mouse over it.

11) If you want to insert the current date & time, your username or full name, into the title of a report that
you are sending to someone else’s WebI inbox, chance the selection for “Target Name: ” from
Automatically Generated to Use Specific Name , and from the Add Placeholder drop-down, choose items to
add.

Issue: # of pages in PDF mode more than in WebI mode

Resolution:

Two things that are causing this.

1. The structure of your report width goes over the width of the first page. Change the report to structure mode and you may find that you have part of a table going past the boundary. Change that and the blank pages will disappear. 


2. PDF will show the exact same number of pages as Webi if you view Webi in Page view. (its the button next to the Structure button). Otherwise Webi shows the pages in a default view which is actually about 3 - 4 times the size of a normal A4 page.

Monday, July 30, 2012

Configure SAP SSO in SAP BO 4.0


To Set up SSO access for SAP authentication:
  1. Login to CMC with Administrator privilege.
  2. Go To Authentication -> SAP from the Home Page
  3. Entitlement Systems Dialog Box opens up
  4. Choose  Role Import Tab and add the required roles
  5. Check if SAP Authentication is enabled on the Option tab
  6. Import keystore file
    The message
    No key store file has been uploaded indicates no previous uploads
  7. Setup Key Store/Private Key password, Private Key Alias and System ID
  8. Setup Security Token Service
    The Security Token Service is running as part of Adaptive Processing Server (APS)
    Go to CMC -> Servers and check if APS has Security Token Service
    .If not, stop APS and add Security Token Service, then start APS

Generate keystore and certificate
  1. Run PKCS12Tool program to generate keystore
    PKCS12Tool Windows location: <INSTALLDIR>\SAP BusinessObjects Enterprise XI4.0\java\lib
    PKCS12Tool Unix location: <INSTALLDIR>/sap_bobj/enterprise_xi40/java/lib
    (Windows command line example: "C:\Program Files (x86)\SAP BusinessObjects\SAP BusinessObjects Enterprise XI 4.0\win64_x64\
    sapjvm\bin\java" -jar PKCS12Tool.jar -alias mywin -storepass admin1 -dname CN=palmtree )
Keystore File is generated at this location:
Capture.JPG

2.     Generate certificate with keytool
Enter keystore password which is defined in the previous step. (In this example the password is: admin1)
(Windows command line example: "C:\Program Files (x86)\SAP BusinessObjects\SAP BusinessObjects Enterprise XI 4.0\win64_x64\
sapjvm\bin\keytool" -exportcert -keystore keystore.p12 -storetype pkcs12 -file cert.der -alias mywin )

Capture.JPG

How Many's!!!

  • ()